The Labor Metric Every Operator Tracks, And Why It’s Lying to You
- By Harri Insider Team | June 8, 2026
There’s a moment Jim Taylor describes that every operator on the call had lived through.
You’re sitting at a restaurant. The meal is winding down. Someone at the table says, “Should we stay for dessert?” And someone else, eyes scanning the room, says: “We haven’t seen the server in 15 minutes. Let’s just go.”
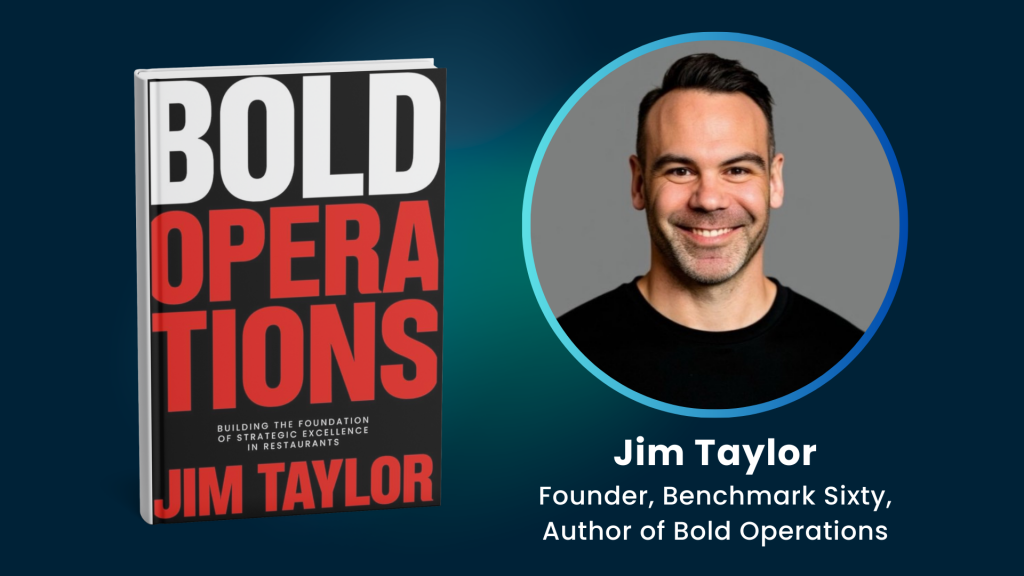
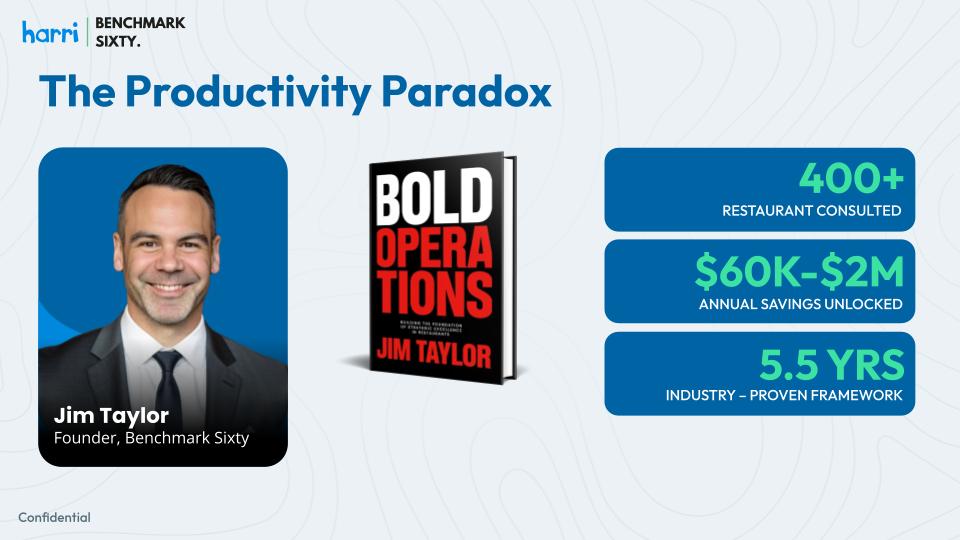
That’s not a service complaint. That’s a line item. A measurable, preventable decline in average check, triggered directly by an understaffed floor. And according to Jim Taylor, founder of Benchmark Sixty and one of North America’s only labor optimization consultants dedicated exclusively to the hospitality industry, it’s happening in restaurants everywhere, every night, as a direct consequence of the way most operators manage labor.
Over the past 6 years, Jim has consulted with more than 400 restaurant operations, helping them uncover anywhere from $60,000 to $2 million in annual savings. He has seen one pattern repeat with uncomfortable consistency: operators cut hours to hit their percentage targets, service suffers, sales drop, and the labor percentage barely moves. They didn’t fix the problem. They shrank the business.
The Metric That’s Lying to You
The problem, Jim explains, is fundamental: labor cost percentage is a result, not a strategy. It’s a lagging indicator. By the time it shows up on your P&L looking bad, the damage is already done, and the instinctive response makes everything worse. Jim calls the pattern the Death Spiral.

The Counterintuitive Fix
Here’s where it gets uncomfortable. Jim’s data from 400+ restaurant consultations points to a conclusion that contradicts everything most operators have been trained to believe:
The most profitable operators deliberately run 2–3% higher labor than their lean competitors. And they bank millions more in profit.
Jim walked through a real example. A full-service restaurant running lean at 25% labor had devolved into something almost unrecognizable. Servers were managing eight-table sections with no bandwidth to upsell. Management turnover had hit nearly 100% annually. And in perhaps the most vivid detail of the entire session: bartenders had moved a cold station behind the bar so they could mix salads themselves, just to keep labor costs down.
The recommendation Jim made was counterintuitive: add people back. Intentionally lower productivity. Let the team do their actual jobs.
Labor climbed to 28%. It stayed there for about 60 days. Then it dropped back to 25% on its own, because properly staffed teams drove average check up, table turns improved, and revenue grew. The labor percentage came down without anyone cutting a single hour.
The final tally: +22% average check. +15% table turns. +$400,000 in annual revenue. Turnover cut in half, saving another $105,000.
The Two Numbers That Actually Matter
So if labor cost percentage is the wrong scorecard, what should operators be tracking instead? Jim introduced two metrics that he says changed his entire career.
Covers Per Labor Hour (CPLH) — total guests served divided by total labor hours. Unlike labor cost percentage, CPLH is predictive. It tells you what’s happening now, before it shows up on the P&L.
Sales Per Labor Hour (SPLH) — total revenue divided by total labor hours. Particularly useful for back-of-house operations and QSR environments where check sizes vary.

The optimal zone for full-service restaurants sits between 2.5 and 5.5 CPLH. Below 2.5 and you’re likely overstaffed. Above 5.0 and your team is getting crushed, burnout and turnover are coming.
“Covers per labor hour changed my entire career,” Jim said during the session. “Not just my consulting practice, my entire view of what restaurants are and how they work.”
You Probably Don’t Have a Quantity Problem
The single most surprising finding Jim shared, and the one that generated the most reaction in the room, was this:
Most restaurants already have the right amount of labor. It’s just in the wrong places at the wrong times.
One multi-unit operator proved the point dramatically. Opening shifts were chronically overstaffed by 20%. Saturday nights were running 15% thin. No hours were added, none were cut. The team simply moved existing hours to where demand actually lived.
The result: $2 million in annual savings. Front of house only.

Complimentary Labor Consultations
We’re teaming up with Jim to offer labor consultations to qualifying operators for a limited time.
His methodology focuses on deploying labor with precision using productivity metrics that traditional labor cost percentages miss. Clients have saved up to $2M by identifying scheduling misalignments, optimizing shift structures, and aligning labor to actual demand patterns.
Consultations include:
- Side-by-side location comparisons (your best vs. worst performers)
- Optimal productivity zone mapping (your CPLH & SPLH targets)
- Inefficiency callouts (exactly where you’re losing money and why)
- Preliminary ROI projections ($60K–$2M typical savings range)
- Prioritized action plan with quick wins you can implement immediately
To apply for a labor consultation with Harri and Benchmark Sixty Founder Jim Taylor, email consulting@harri.com.